
Foundational analysis is required before initiating a strategic data enablement program to build a big data capability for risk and governance. How should that foundational analysis be organized to be successful?
This article is the third of a series of five articles. The first and second articles can be read here and here respectively.
Risk and governance functions are investing heavily in strategic data enablement programs that promise to transform financial institutions’ risk and governance capabilities through deployment of big data capabilities, advanced data integration platforms and the rich data visualization capabilities of business intelligence toolsets. However, the improvements in analytical insight and reporting efficiency from investments in the deployment of toolsets have tended to be marginal rather than transformational. Implementing new tools alone creates reporting that is more visually attractive, but the new reports rarely say much more than their predecessors.
This series discusses the valid reasons for the risk or governance function to invest in a strategic data enablement program to deliver these capabilities and explain what needs to be done by the risk or governance function before anything is spent on the implementation of new toolsets.
What needs to be done before technical design and implementation can start?
The first article in this series discussed the impediments to creation of analyses of exposures that span the institution without the need for time consuming manual data cleansing and consolidation activities. The article argued that achieving this necessitates the creation of a 360° view of the necessary data i.e. a single, consistent version of truth of the institution’s risk exposures and the financial obligations and activities that they arise from. Consistent, in this context, means that data is organized in this authoritative source the same way regardless of the source systems, businesses, organizations, locations, jurisdictions, entities or geographies that those data have been sourced from.
Before the technical solution can be designed and implemented foundational analysis is required to identify and articulate the business requirements for the 360°view. The second article explained that these business requirements must articulate the requirements for the integration and organization of data in the solution. Reports, dashboards and other data analyses are created to enable informed risk management decision-making conversations. The objective of those conversations is to decide whether to accept or manage individual exposures (see “The Risk Conversation” in the previous article). To make informed decisions, participants ask analytical questions to understand and contextualize exposures. Analyses of exposure are created to answer these analytical questions. Consequently:
The business requirements for the integration and organization of data identify the set of information concepts [See Endnote 1] and business rules that define the valid ways that information concepts can be, and need to be, combined so that all possible analytical questions can be asked and valid answers obtained.
To enable successful implementation of the 360° view these business requirements need to be captured in a single business-owned, logically organized, internally self-consistent artifact that effectively and unambiguously communicates those requirements to stakeholders and implementation partners. The most effective way to do this is by creation of an Information Model.
What is an Information Model?
An Information Model is:

Business authored and owned
The Information Model is business authored and owned. To ensure it can be understood and challenged by executives and subject matter experts (SMEs) it is presented in simple business diagrams that do not use any technical notation.

Internally self-consistent, logically organized and captures all the information needed by all users of the requirements in a consistent and unambiguous format.
To achieve this is its maintained using a formal data modelling methodology ideally within a data modelling tool.
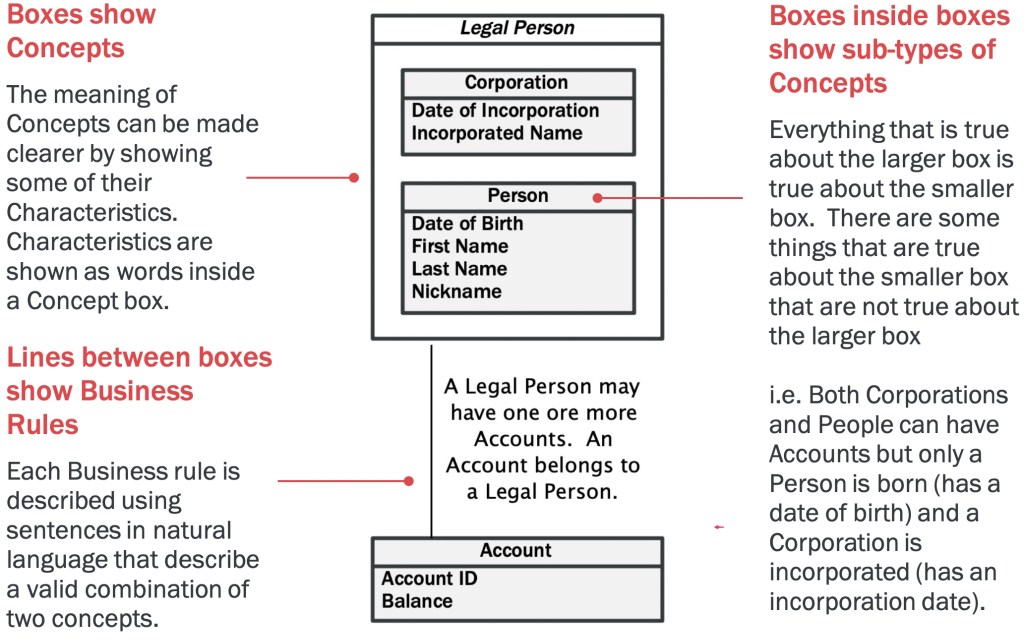
The Information Model’s contents are presented in a series of business diagrams that only use boxes, lines and words. These diagrams enable business SMEs to challenge the model to determine whether:
- All the necessary information concepts are included and understood correctly; and that
- The information concepts can be combined using the model’s business rules to ask the analytical questions needed to support risk decision-making conversations and to combine concepts to obtain meaningful answers.
Business requirements are normally captured in Business Requirements Documents (BRDs). To understand why the creation of a routine BRD is insufficient and the benefits of investing in creating an Information Model it is useful to understand how these requirements will be used.
How will the business requirements for the organization and integration of data be used?
The authoritative version of the truth that provides the 360° view of exposure will be implemented within some form of a data warehouse. A data warehouse is a (normally relational) database where data from many different source systems that each organize those data in different ways is collected together and physically represented in a single set of data tables using a single consistent organization.
Data Architecture
The organization of the data tables in the warehouse is designed by a data architect within a data model [See Endnote 2]. A physical data model defines the set of physical tables and the constraints within the database that allow data from different tables to be combined to provide meaningful answers to queries and enable the creation of reports.
The eventual physical data model needs to have a way to hold data representing each of the required real-world information concepts. However, the information concepts are not necessarily represented on a one-to-one basis by tables. During the design process data architects will make decisions to change the shape of the data (e.g. representing several similar information concepts using a single table) [See Endnote 3].
The information concepts and business rules identified within the information Model provide a robust starting point for data architects to identify the data entities and relationships that need to be modelled in the design process.
The solution may alternatively be implemented using a vendor solution that has a pre-existing data model. In this case the information concepts and business rules of the business requirements provide the basis to assess whether the vendor’s data model is:
- Is complete i.e. can represent all the required information concepts; and
- Enables implementation of data integration requirements i.e. allows data in data tables representing the required information concepts to be combined in all the required ways articulated by business rules within the requirements.
Data Governance
Data Quality Management [See Endnote 4]
The information concepts in the data organization / integration business requirements identify and define unique types of data records that data standards should be defined for. It also identifies many detailed data quality requirements that should be tested through data quality monitoring.
Master Data Management [See Endnote 5]
The data organization / integration business requirements can be used to identify each of the reference / master data information concepts for which golden sources need to be identified or established.
Rules of the road: Do’s and don’ts for creating an effective Information Model
The next article in this series will elaborate an approach for leveraging the subject matter expertise of the risk function to create the information model. For this foundational analysis to be successful the process must achieve the following:

Business authored and owned
The information concepts and business rules in the model capture the vocabulary and grammar used to express the analytical questions decision-makers need answered to make risk management decisions. They are capturing the way in which those business conversations are expressed. The artifact that articulates those definitions therefore needs to be business authored and owned.

Understand and design for analytical requirements
The objective of creating the 360°view of exposure is to enable analytical insight to support decision-making i.e. to enable the creation of analyses that answer the questions business stakeholders need answered before they can make decisions.
The analysis process must identify what those analytical questions are in order to define requirements for how data needs to be organized and combined to answer them.
Many reports are created because they have been used for a very long time. They are presented to governance forums as part of long-established procedures. However, many of the people using them find it hard to articulate exactly what specific questions they answer. Those reports may now be used to answer different questions from the ones they were originally created to answer. There may be better ways to answer those questions. The analysis process should start by cataloging the actual questions that users of risk analytics need answered rather than cataloging the existing reports. Existing reports also do not address scenarios that have not yet been encountered. It’s hard to anticipate the future. On the other hand, that is one of the purposes of a formal risk discipline. The analysis process should include identification of future stress scenarios that might be encountered that cannot be easily understood using current analytical capabilities i.e. understanding them would require analyzing data in very different ways from the way it is organized to satisfy routine analytical needs. For example, understanding how credit defaults may arise in the aftermath of a pandemic requires fine-grained segmentation of exposure data by geography and industry types.

Support the perspectives of both the first and second lines of defense
The decision-making needs and analytical perspectives of the first and second line are different. A model designed only to aggregate data into a single overall view of the enterprise will not necessarily provide business management with views that allow them to see their business in the way they need to manage it on a day-to-day basis.
The first line of defense will be fully invested in the data quality of a single version of truth if it can be used to support decision-making in the day-to-day context of each business.
The data needed for risk analysis is the data of the business, i.e. it is the data of the first line of defense. The identification of themes across the institution and locating exposures within parts of the organization requires categorization with reference data. These activities are most effectively done at the point of capture of the data i.e. by the business. However, the cross-business thematic analysis this categorization enables is of limited use to the business line. Unless the business line receives something in return for making the effort to accurately categorize data using organizational hierarchies and taxonomies then this activity is effectively a tax on the business. If the analysis process however captures the first line’s business requirements, then the resulting single source of truth will provide new and insightful analytical capabilities for the first line of defense. They will receive a significant return for their investment in ensuring the quality of the categorization of source data.

Enable common semantics
Since the information concepts and business rules articulating the vocabulary and grammar of risk conversations the model is therefore capturing the semantics of the business. Different second line and first line functions may understand and use terms slightly differently i.e. there may be many dialects in the use within the business and/or the practice of risk management with an institution. These need to be captured and reconciled.
The analysis should capture common definitions in business language which can be validated with all stakeholder groups. Validation in the context of the practices of different business lines will identify specialized meanings. An example of a generalized term is “expiry date”. Expiry date however has very specific and different meanings in the context of a residential mortgage and an interest rate swap. The analysis for these specialized definitions ensures that the generalized, i.e. common, definition is consistent with each of the specialized versions.Capturing common definitions for generalized terms is essential for defining a consistent organization regardless of the business, organization, location or data source from which the data originates. Accommodating business-line specific information concepts is essential to ensuring that the resulting authoritative source is useful in the context of each of the business lines.

Structure the modeling problem based on information Domains NOT Stakeholder Groups
Market risk and credit risk are reliant on legacy technology silos that have evolved to support the needs of specific businesses. Analysis purely aligned to these legacy silos will result in replication of current issues that prevent meaningful comparison and aggregation of information across these silos.To ensure that the resultant organization represents a genuinely common view across risk types, analysis should start with the creation of an overall view of the organization of the core information domains first: Assembling common views of information across legacy data silos is analogous to assembling a 10,000 piece jigsaw puzzle without a picture. This target “picture” allows organization of the analysis by information domain. This overall picture should however be continually challenged as analysis progresses and may change.

Enable business ownership of the information model and creation of data architecture by technology
The model should be documented as a business artifact to ensure comprehension and ownership of the information model by business stakeholders. If artifacts look and read like “technology documents” then business stakeholders will not feel that they are the owners of the model and will probably defer to their technology partners for any work related to it.
Key information that is vital for the data architecture process (e.g. detailed attributes to precisely define business rules) can be captured during the business requirements analysis process. Capturing this information at this stage has significant benefits in terms of enabling effective / efficient communication with Risk’s technology partners.The information model should therefore be documented in a format that can be traced by data architects into logical and physical data models. Different views of the Information Model created for business and technology audiences should be sourced from a common representation of the model within a data modeling tool.
Conclusion
The creation of an information model enables the business requirements for the organization and integration of data to be:
- business-owned and authored; and
- maintained in a single internally self-consistent, logically organized representation of how data needs to be organized consistently regardless of location, organization, data source, geography etc. or other way it is it is sourced;
- while accommodating different dialects and business-specific requirements of different businesses and first line of defense organizations;
- while enabling effective and efficient communication with risk management’s technology partners.
The next article in this series will elaborate an approach for leveraging the subject matter expertise of the risk function to create the information model.
Endnotes
Endnote 1
An information concept was defined in the second article in this series as a real world “thing” that we need to hold data about e.g. a person, a geographic address, an account, a calculation.
Endnote 2
An Information Model can also be described as a Conceptual Data Model. A Conceptual Data Model is a model that “describes various things of significance to the enterprise and makes assertions about how they are related to each other. It is not in any way concerned with the technology that might be used to manage information. It captures the language of the business and elaborates upon it” (Hay, 2018).
Endnote 3
Two technology design data models are normally created:
A Logical Data Model (LDM) is a technology design artifact created by a data architect that shows how the data held in the solution will be organized. The data architect makes design decisions that may result in differences between how the data is represented in tables from how the information concepts are defined in the requirements. This may be done to satisfy non-functional requirements such as reporting efficiency, query performance, security and privacy. The LDM also includes additional data entities that are designed to support data management activities performed by the solution (e.g. mapping tables to support standardization of reference data code sets such as currency codes used by source systems to a standard set off values).
A Physical Data Model (PDM) is a technology design artifact created by a data architect that contains a one-for-one representation of all the elements of the implemented database (tables, constraints etc.). Additional design decisions are made to accommodate the specific needs of the type of Database Management System (DBMS) selected (e.g. a specific relational database product such as Oracle of Microsoft SQL Server).
Endnote 4
An essential component of an effective data governance program is data quality management i.e. the activities conducted to assure that data is fit for consumption Key activities include the definition of data standards and the measuring and monitoring of data quality, the subsequent identification of data quality issues and the taking of corrective action.
Data is of high quality to the degree that it meets the expectations and needs of data consumers. That is, if the data is fit for the purposes to which they want to apply it. (DAMA International, 2017). The requirements that data representing a specific information concept must satisfy to be fit for purpose are defined in a data standard. Data records are tested to ensure that they satisfy these requirements as part of data quality monitoring.
The data organization / integration business requirements will identify the unique information concepts that data standards should be defined for. They provide a starting point for the requirements that will be enforced through the data quality management program for data representing that concept.
[Data Quality Management is more formally defined as “The planning, implementation, and control of activities that apply quality management techniques to data, in order to assure it is fit for consumption and meets the needs of data consumers.” (DAMA International, 2017).]
Endnote 5
The technical solution will make use of data sourced from across the institution which will be described using data from multiple different sources of reference data[5] and master data. In order to be usable as a single authoritative version of truth the data that is consolidated and standardized within the solution must make use of a single set of reference data and master data. This involves identifying or creating golden sources for each type of reference or master data. The data organization / integration business requirements will identify each of the reference / master data information concepts for which golden sources need to be identified or established.
[Reference Data is data such as code and description tables used to characterize other data in an organization (e.g. currency codes used to describe the currency of a transaction)]
[Master Data is data about the business entities (e.g., employees, customers, products, financial structures, assets, and locations) that provide context for business transactions and analysis (DAMA International, 2017). It includes:
- Enterprise Structure Data: data that enables reporting of business activity by business responsibility (e.g. a chart of accounts and organizational hierarchies) (Chisolm, 2008); and
- Transaction Structure Data: data that describes the things must be present for a transaction to occur (e.g. customers: customer identifiers, customer addresses) (Chisolm, 2008).]
Bibliography
Chisolm, Malcolm. 2008. What is Master Data? BeyeNETWORK. [Online] February 6, 2008. http://www.b-eye-network.com/view/6758.
DAMA International. 2017. Data Governance. DAMA-DMBOK Data Management Body of Knowledge. Basking Ridge : Technics Publications, 2017.
Hay, David C. 2018. Introduction. Achieving Buzzword Compliance: Data Architecture Language and Notation. s.l. : Technics Publications, 2018, pp. Kindle Locations 352-355.
Dan Shalev is an Information Architect and Governance, Risk and Compliance (GRC) professional focused on enabling data-driven business decision-making. His key focus and passion is the enablement of business decision-making using consistently organized data irrespective of the systems, businesses or geography those data have been sourced from. Dan can be contacted at dan.shalev@bifrostanalytics.com.
© 2013 – 2020 Dan J Shalev. All rights reserved.

1 comment