
Should risk and governance functions invest in big data and advanced business intelligence solutions and what are the business benefits?
This article is the first of a series of five articles.
Risk and governance functions are investing heavily in strategic data enablement programs. These programs promise to transform financial institutions’ risk and governance capabilities through the deployment of big data capabilities, advanced data integration platforms, and the rich data visualization capabilities of business intelligence toolsets. However, the improvements in analytical insight and reporting efficiency from investments in the deployment of toolsets have tended to be marginal rather than transformational. Implementing new tools alone creates reporting that is more visually attractive. The new reports, however, rarely say much more than their predecessors.
This series will explore the valid reasons for the risk or governance function to invest in a strategic data enablement program to deliver these capabilities. It will also explain what the business needs to do before starting to invest in new toolsets.
Isn’t risk and governance decision-making already data enabled?
Risk and other governance disciplines (including Compliance and Finance) are highly dependent on the analysis of data. Business decision-makers rely on suites of reports analyzing exposures from many different perspectives to make routine risk management decisions. These include many choices every day about whether to extend or withdraw credit or hedge market positions. These decisions also include decisions to investigate, analyze, and take remedial action to address operational and infrastructural vulnerabilities. Models consume vast quantities of data to calculate risk measures that enable understanding of financial risk exposures. Behavioral risk and governance disciplines (e.g., fraud detection) are making increasing use of artificial intelligence to analyze similarly vast quantities of data.
The automation of reporting to understand aggregate exposures that span multiple businesses across an institution is less effective. Creating the aggregate analyses needed for these purposes tends to require significant manual effort and is very time-consuming. These analyses are needed (amongst other reasons) to:

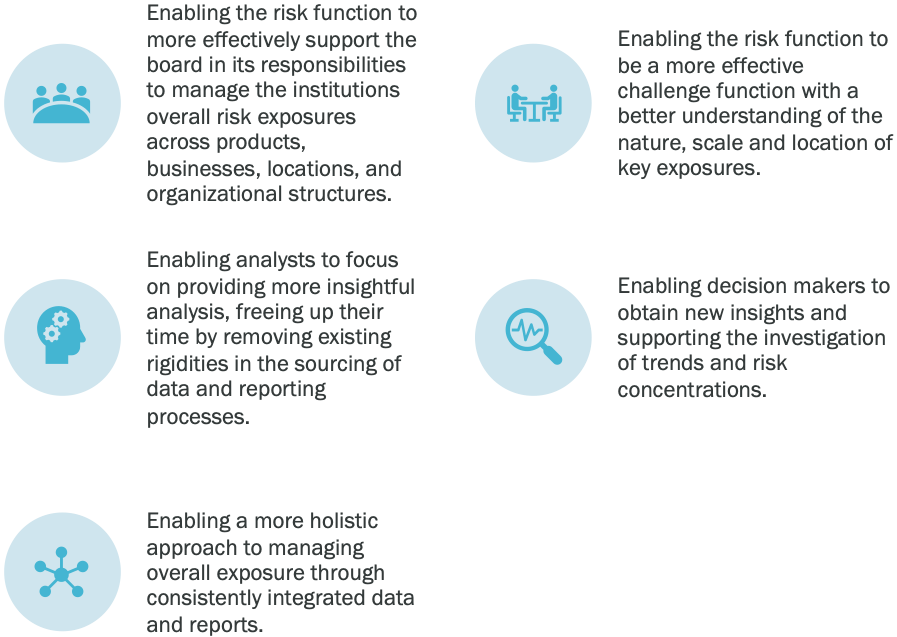
Enabling the board of directors (or the management committee or other senior leadership on their behalf) to fulfill their responsibility to manage the institutions overall risk exposures across products, businesses, locations, and organizational structures.

Enable the second line of defense to be an effective challenge function. A challenge capability requires analytics that allow the nature, extent, and location of critical exposures to be understood, i.e., the ability to see the forest from the trees.

Creating analyses to enable decision-making during rare and unusual business conditions.
The types of unusual business conditions include financial shocks or those caused by extreme weather events, epidemics or other similar major events [See Endnote 1]. Gaps between contingency planning (based on anticipated events) and what is needed to respond to an actual event can be identified and understood from analysis of data from across the institution.

Much institution-level regulatory reporting requires similar aggregation of data sourced from across businesses.
Why is it so hard for risk and governance functions to create aggregate analyses?
The issues with creating these analyses include the following:

Creating these analyses requires combining data from across different businesses, source systems and internal organizations. Analysts must manually consolidate different data sets sourced from multiple different source systems, organized using data models structured differently to meet the needs of very different businesses and categorized using different sets of reference data.

The process is time consuming and the reports tend to only be ready to be presented a considerable time after the date they relate to. Data presented to decision makers can therefore be stale. The reporting is effective for governance purposes to assess the appropriateness of decisions made by the business line at the time. It is of limited usefulness however for active decision-making.

To rely on aggregations, they must be reconciled to an authoritative source. The only universal source of aggregated data for the institution is the general ledger. Balances in the general ledger are not however created from the aggregation of individual accounts. The process of double entry bookkeeping is used to calculate them which means that end of period of balances are calculated by applying aggregate movements in value to a balance from the beginning of the period. Reconciling balances created this way and aggregated using financial reporting account hierarchies to balances aggregated for decision-making purposes is an inherently frustrating activity.

Analysts spend considerable time resolving inconsistencies and other data quality issues before the analyses can be presented.

Analysts get frustrated and leave. This is not what they signed up for. Financial institutions go to great lengths to recruit graduates from data science programs. They look forward to applying their training to perform complex data analysis and then find that they spend most of their time engaged in tedious data cleansing activities. Analysis of data of large online retailers does not involve the complex mathematics of financial modelling. However it does involve working with consistently organized large data sets with low levels of data quality issues that are ready to be analyzed using the quantitative techniques that the data science graduates were hoping they were going to make use of when they accepted their job offers to work at a sophisticated financial institution.
Isn’t there a better way?
The combination of big data technologies combined with the advanced visualization capabilities of contemporary business intelligence tools promise to provide a future state where decisions can be made based on a 360° view of the enterprise’s data and consequent risk exposures. These technologies have already revolutionized data analytics within many industries. An often cited example is Amazon which has a near omniscient understanding of its customer’s buying patterns and preferences.
The paradigm promises a future state in which decision-makers can generate dashboards on a push button basis which can be manipulated directly by the decision-maker to obtain appropriate perspectives to support specific decisions. Decision-makers would be able to do this without the need for analyst-performed data preparation or cleansing activities.
Creating a 360° view of data necessary to understand the risk exposures of a complex financial institution is however much more involved than understanding the purchasing behavior of the customers of even an exceptionally large online retailer. Risk exposures are the consequence of the financial obligations that each of an institution’s businesses create between the institution and its customers and other parties. They also arise from vulnerabilities and control gaps in the processes and infrastructure that the institution operates and relies on to operate its businesses.
A 360° view of data necessary to understand the risk exposures of a complex financial institution therefore requires a single, consistent version of truth of the institution’s risk exposures and the financial obligations and activities that they arise from. Consistent, in this context, means that data in this authoritative source is organized in the same way, regardless of the source systems, businesses, organizations, locations, jurisdictions, entities or geographies that those data have been sourced from.
The potential benefits of having this 360°view of exposure include:
Why don’t these initiatives succeed?
Major technology implementation programs normally start with the articulation of the business requirements that the solution is supposed to satisfy. However, programs to implement strategic data solutions often use as starting points data models that are marginal refinements on, and consolidations of, existing models.
The normal focus of the formal business requirement exercise, if there is one, is the removal of the current known pain points within existing reporting. This does not however identify what needs to be done to answer the questions that need to be answered to respond to scenarios that have not yet been encountered. Existing models and reports are migrated to newly implemented technologically current infrastructure and business intelligence tools. The reports look a lot prettier than they did before, but they say little that is new.
One of the reasons why there is no formal capture of business requirements at the beginning of the data enablement program is that articulating business requirements for the integration of data is quite different from articulating business requirements for processing capabilities.
The next article in this series will examine what needs to be identified and understood to articulate the business requirements for a strategic data enablement program.
Endnotes
Endnote 1:
Flood waters (and pandemic infection zones) rarely stop neatly at the boundaries of zip codes
Creating analyses to enable decision-making during rare and unusual business conditions involve similar manual and time-consuming efforts. These all require analyzing exposures in ways that are different from those used for business-as-usual reporting. For example, financial institutions normally apply internal limits to exposures on a business line basis (i.e. limits are aligned to the organization chart). However, when credit and liquidity is constrained it is essential to understand concentrations of exposure in individual legal entities.
Putting these analyses together to understand exposure to unique specific events involves analysts who have a detailed understanding of the data models of individual data warehouses and source systems writing bespoke queries to pull out the necessary data. They then hand it over to other analysts to consolidate. Regulators requested exposure information in the immediate aftermath of the collapse of Lehman Brothers in 2008 and asked for the information to be delivered within 48 hours so they could rapidly identify the next possible Lehman and take steps to prevent a domino effect. Many large, sophisticated institutions were still struggling to put together the requested analyses during the following week.
The impact of major weather events or epidemics tend not to line up against pre-existing geopolitical boundaries used for business-as-usual geographic analyses: Flood waters (and pandemic infection zones) rarely stop neatly at the boundaries of zip codes.
Dan Shalev is an Information Architect and Governance, Risk and Compliance (GRC) professional focused on enabling data-driven business decision-making. His key focus and passion is the enablement of business decision-making using consistently organized data irrespective of the systems, businesses or geography those data have been sourced from. Dan can be contacted at dan.shalev@bifrostanalytics.com.
© 2013 – 2020 Dan J Shalev. All rights reserved.

1 comment